MIPIM: Retail deals fell 5% in 2013, as the sector continued to act as a drag on the commercial property recovery.
According to figures from EGi Research 29m sq ft of retail deals were signed nationwide, against a UK commercial property total of 219m sq ft, a 3.5% rise on the previous year.
Hardest hit were Yorkshire & Humberside and Scotland, which both saw the amount of space signed for compared to 2012 drop by more than a fifth. The West Midlands, North East, and East of England also fell into the red last year. Deals dropped as the amount of A1 space lost continued to accelerate. More than 1.7m sq ft of retail space was lost to other uses in 2013, with 1.3m sq ft converted into leisure space.
London and Wales registered the greatest rises and overall the number of units swapping hands rose by 8% as deals shrank.
The office sector led the industry out of the recession with deals up nearly a fifth in 2013 compared to the previous year, notching up nearly 57m sq ft of deals nationwide.
The sector, which rose 17% last year, stood head and shoulders above industrial and retail and was the driving force in the UK’s commercial property sector.
The East of England’s office market saw the biggest gains up 91% in the year against London’s 32%, helped by a record year for the Cambridge office market and a strong Q2 performance for Norwich.
Northern Ireland, East Midlands, and the South West all saw volumes drop, with the East Midlands down by a third.
Drilling down to the major cities, figures improved further. Anna Reed, head of EGi Research, said: “Of the big hubs Leeds, Cambridge, Glasgow, Newcastle, Reading, Birmingham, and Liverpool all increased office-take up by more than 50% year-on-year.”
In the industrial market, where EGi data covers all industrial use types, the amount of space transacted inched up by a single percent. Reed added: “The increase in occupier take-up was more modest as retailers started to satisfy their big box requirements in the latter part of 2012.”
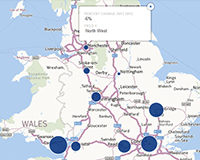
Click on the graphic below to see how each region performed. The size of the bubbles relates to the number of deals done in each region. Click on the visible layers box in the map to choose between views of All property; Offices; Retail; and Industrial. Click on the bubbles over each region to see the % change 2012 vs 2013.
Nadia.Elghamry@estatesgazette.com


