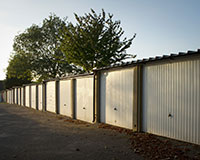
Councils are sitting on more than 22,000 empty garages in London, according to research by property crowdfunding platform Property Partner.
The data, obtained from a Freedom of Information request, showed that 24 of London’s 32 councils owned 53,640 lock-up garages, 41% of which were empty. The total stock, if converted to one-bed flats, would be the equivalent of 16,000 homes.
More than 70% of garages in Ealing, Havering and Brent were unused, while in Lambeth the figure was just 1%.
Property Partner said the number of potential homes in that space would rise to more than 64,000 if four-storey apartment blocks were built in those locations.
Dan Gandesha, chief executive of Property Partner, said: “This is just a snapshot of publicly owned land in London which is clearly surplus to requirement, underused or undeveloped.
“When we have a crisis in affordable housing not just in the capital but in the UK, it begs the question whether councils in Britain should either sell off the land for development or build new homes themselves.”
According to the London Assembly, the capital needs between 49,000 and 80,000 homes per year to cope with projected population growth but is delivering less than half of that.
Six boroughs – Westminster, Wandsworth, Richmond Upon Thames, Merton, Bromley, and Bexley – no longer owned garages or had outsourced them to housing associations.
London boroughs
Number of council-owned garages
% of empty garages
% of rented garages let to council tenants
Total sq ft of council-owned garages
Total number of one-bed flats (avg 499.4 sq ft)
Barking and Dagenham
2,276
53%
43%
341,400
683.6
Barnet
1,941
40%
32%
291,150
583
Brent
1,729
71%
10%
259,350
519.3
Camden
2,521
35%
59%
378,150
757.2
Croydon
3,026
31%
34%
453,900
908.9
Ealing
2,008
74%
59%
301,200
603.1
Enfield
2,874
70%
63%
431,100
863.2
Greenwich
4,647
57%
92%
697,050
1395.8
Hackney
3,878
41%
60%
581,700
1164.8
Hammersmith and Fulham
1,270
33%
79%
190,500
381.5
Haringey
2,019
43%
32%
302,850
606.4
Harrow
775
54%
36%
116,250
232.8
Havering
2,054
72%
57%
308,100
616.9
Hillingdon
2,597
22%
44%
389,550
780
Hounslow
2,111
42%
39%
316,650
634.1
Islington
2,705
34%
47%
405,750
812.5
Kensington and Chelsea
449
10%
91%
67,350
134.9
Lambeth
2,257
1%
50%
338,550
677.9
Lewisham
2,123
10%
94%
318,450
637.7
Newham
2,635
42%
49%
395,250
791.4
Redbridge
980
32%
n/a*
147,000
294.4
Southwark
6,624
29%
87%
993,600
1989.6
Sutton
1,074
18%
52%
161,100
322.6
Tower Hamlets
1,324
12%
n/a*
198,600
397.7
TOTAL
53,640
–
–
8,046,000
16,111
AVERAGE
2,332
41%
55%
–
–
Click here to download a PDF of the full data
• To send feedback, e-mail karl.tomusk@estatesgazette.com or tweet @ktomusk or @estatesgazette