


Manchester main image credit – www.staceymacnaught.co.uk/www.tecmark.co.uk
Multinationals moving their operations across the country, billions of pounds of infrastructure investment and even wild fluctuations in commodity prices have changed the fortunes of regional office markets over the last decade.
Now, for the first time, EG has analysed take-up data from Radius Data Exchange to plot the UK’s most resilient – and cyclical cities – over the last 10 years.
The analysis shows how bigger cities have fared against smaller ones, and how activity across the regions over the past decade compares with London.
And while this data is not, of course, a measure in itself of a city’s success, it illustrates starkly the impact of major lettings, the difference regeneration can make and the impact of macro-economic factors.
Most resilient, most cyclical
Bristol has been the most consistent major regional city since 2008. Among the six cities that have averaged an annual take-up of at least 1m sq ft, Bristol has recorded the smallest percentage difference between its least active year (830,949 sq ft in 2009) and its average (1.1m sq ft) with just a 26.2% dip.
By contrast, the difference between Leeds’ least active year (2010) and its average (1.2m sq ft) was 39.3%, while in Manchester the difference was 36.4%.
Highest peaks
The biggest fluctuations tend to happen outside the top six. Cambridge and Aberdeen have had the biggest peaks relative to their averages among the 15 most active cities.
AstraZeneca taking 715,000 sq ft in Cambridge in 2013 caused take-up to spike to 1.8m sq ft that year. Its global HQ – now a whopping 850,000 sq ft opens fully later this year.
To put that into context, average take-up in Cambridge is 803,000 sq ft per year.
Aberdeen is another market to see have seen sharper rises and deeper falls than most.
CITIES INVESTMENT OVERVIEW:
The South and Wales
Scotland and Northern Ireland
Acker Solutions took 335,000 sq ft in 2014, pushing the year-end total to 1.5m sq ft – compared with a 10-year average of 692,000 sq ft.
At one point in 2013, there was only 10,000 sq ft of grade-A office space available in Aberdeen to satisfy more than 1m sq ft of active requirements.
Following the crash in the price of oil (which hit a low of around $28 per barrel in 2015), Aberdeen’s property market suffered a consequential slump in activity, where take-up fell and supply of accommodation across all sectors increased.
However, in tandem with the strong recovery in the price of Brent crude seen in recent months – which went through the $70-a-barrel barrier last week – the city’s office occupier market is picking up once more.
Birmingham v Manchester
The competition between the big two regional cities, Birmingham and Manchester, both with around 15.7 million sq ft in total, has ended in Birmingham’s favour in the past three years.
After big lettings to HSBC and Deutsche Bank few years ago, Birmingham has recently benefitted from GPU’s real estate strategy with 240,000 sq ft letting in Arena Central in 2017.
For the purposes of this study, Salford is counted as separate postal town which, if included in Manchester take-up would add more than 3m sq ft to the 10-year total.
That said, even if Salford’s 224,000 sq ft take-up last year was to be added to Manchester’s total, Birmingham would still take the top spot in 2017.
Winners and losers over time
An analysis of EG data shows the general direction of take-up over the past 10 years, separating the steepest increases from the steepest decreases over time.
Belfast has grown the most out of the 15 largest regional cities. Within a decade, the Northern Ireland capital has gone from 122,000-150,000 sq ft of annual take-up to between 600,000 and 800,000 sq ft.
Leeds and Edinburgh are close behind. Take-up in Leeds hovered below 1m sq ft for three years before consistently topping that threshold.
CITIES INVESTMENT OVERVIEW:
The North
The East and Midlands
Edinburgh was below the 1m sq ft mark for four years but has stayed above it six years in a row – boosted in 2017 by the 181,000 sq ft Government Property Unit pre-let at New Waverley.
In what is the biggest single office leasing deal in Edinburgh for more than 20 years, the move will involve the relocation of around 2,900 full-time civil servants into the grade-A city centre premises in 2020.
Five cities in the list of 15 have seen take-up heading in a negative direction. Manchester’s take up is the biggest of any city outside London.
However, it has seen take-up fall from close to 2m sq ft annually between 2008 and 2010, to less than 1.3m sq ft over the past two years.
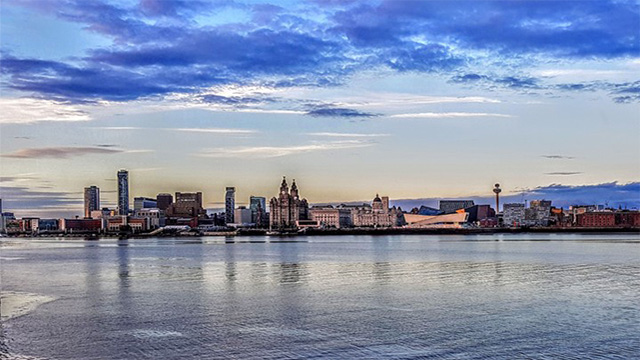
Nottingham and Liverpool make up the rest of the bottom three, but both of these smaller markets have been relatively steady compared with Manchester.
The regions v London
Office take-up in regional cities was suppressed during the financial crisis from 2009 to 2011; with London recovering first.
However, since 2012, the London and regional markets have moved in tandem.
To send feedback, e-mail karl.tomusk@egi.co.uk or tweet @ktomusk or @estatesgazette
![]() For more on Radius Data Exchange and what it can offer click here
For more on Radius Data Exchange and what it can offer click here