The insatiable demand for online retail coupled with London’s growing population – predicted to exceed 10m by 2031 – means industrial land needs to be protected. A new report from industrial REIT SEGRO and planner Turley, Keep London Moving, shows how it is crucial to halt the loss of the capital’s industrial land to other uses. Change of use to residential, together with the growth of e-commerce, is driving the demand for industrial land even further.
SEGRO chief executive David Sleath says: “There needs to be a thorough review of industrial land designation, which recognises the requirements of urban logistics operators to be located where they are able to respond to last-mile activities. We need to ensure the industrial and logistics sector has a voice within London policy decision-making to ensure that the rapid loss of industrial land is reversed and intensification of industrial and logistics uses is possible when practical.” Read more from David Sleath >>
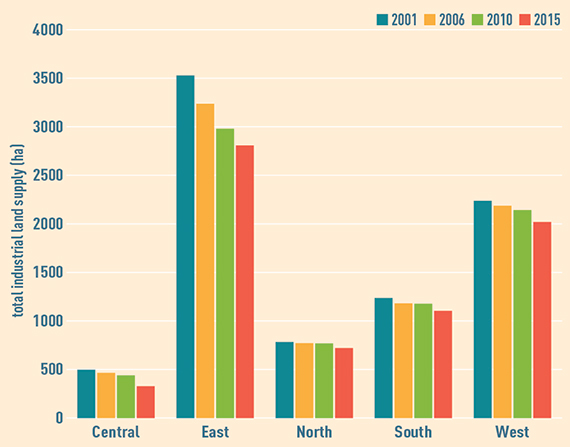
Industrial land supply by sub-region 2001-2015
The supply of industrial land has been contracting since 2001, affecting every sub-region of London.
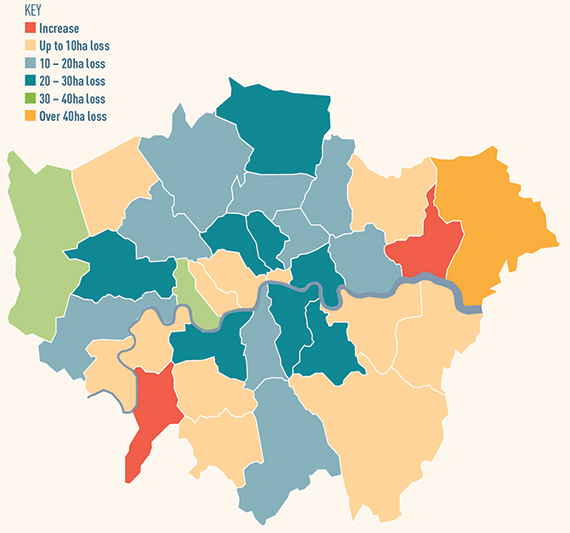
Absolute change in industrial land supply 2010-2015
The London Plan includes provision for the managed release of 37ha of surplus industrial land annually from 2011 to 2031 across the capital. The Greater London Authority has identified the greatest opportunity for release in east London and parts of inner west London, with more limited scope in north and outer west London.
Historic absolute change in industrial land supply by sub-region 2001–2015 (ha)
2001-06
2006-10
2010-15
2001-15
Central
-32
-26
-111
-169
East
-129
-258
-172
-721
North
-12
-3
-48
-63
South
-55
-5
-74
-134
West
-51
-45
-124
-220
London
-440
-337
-528
-1,305
London industrial land loss 2031 target and pipeline (ha)
Industrial land
Industrial land loss from 2010
Equivalent number of Park Royals lost
2010
7,505
n/a
n/a
2031 target
6,700
805
1
Pipeline loss (20 years)
6,147
1,358
2
All eight boroughs in the Park Royal/A40/Heathrow area are likely to exceed their targeted release by 2031. Five are already at the target release level.
Historic absolute change in industrial land supply by sub-region 2001–2015
Total industrial land supply 2020 (ha)
Total targeted loss in industrial land 2011 – 2031
Targeted annual loss of industrial land 2011 – 2031 (ha)
Annual actual loss of industrial land 2010 – 2015 (ha)
Annual potential pipeline loss of industrial land (ha) 20 years
The insatiable demand for online retail coupled with London’s growing population – predicted to exceed 10m by 2031 – means industrial land needs to be protected. A new report from industrial REIT SEGRO and planner Turley, Keep London Moving, shows how it is crucial to halt the loss of the capital’s industrial land to other uses. Change of use to residential, together with the growth of e-commerce, is driving the demand for industrial land even further.
SEGRO chief executive David Sleath says: “There needs to be a thorough review of industrial land designation, which recognises the requirements of urban logistics operators to be located where they are able to respond to last-mile activities. We need to ensure the industrial and logistics sector has a voice within London policy decision-making to ensure that the rapid loss of industrial land is reversed and intensification of industrial and logistics uses is possible when practical.” Read more from David Sleath >>
Industrial land supply by sub-region 2001-2015
The supply of industrial land has been contracting since 2001, affecting every sub-region of London.
Absolute change in industrial land supply 2010-2015
The London Plan includes provision for the managed release of 37ha of surplus industrial land annually from 2011 to 2031 across the capital. The Greater London Authority has identified the greatest opportunity for release in east London and parts of inner west London, with more limited scope in north and outer west London.
Historic absolute change in industrial land supply by sub-region 2001–2015 (ha)
2001-06
2006-10
2010-15
2001-15
Central
-32
-26
-111
-169
East
-129
-258
-172
-721
North
-12
-3
-48
-63
South
-55
-5
-74
-134
West
-51
-45
-124
-220
London
-440
-337
-528
-1,305
London industrial land loss 2031 target and pipeline (ha)
Industrial land
Industrial land loss from 2010
Equivalent number of Park Royals lost
2010
7,505
n/a
n/a
2031 target
6,700
805
1
Pipeline loss (20 years)
6,147
1,358
2
All eight boroughs in the Park Royal/A40/Heathrow area are likely to exceed their targeted release by 2031. Five are already at the target release level.
Historic absolute change in industrial land supply by sub-region 2001–2015
Total industrial land supply 2020 (ha)
Total targeted loss in industrial land 2011 – 2031
Targeted annual loss of industrial land 2011 – 2031 (ha)
Annual actual loss of industrial land 2010 – 2015 (ha)
Annual potential pipeline loss of industrial land (ha) 20 years
Barking and Dagenham
475
-7%
-2
1
6
Barnet
115
-9%
-1
-3
0
Bexley
528
-9%
-2
-1
2
Brent
411
-6%
-1
-2
2
Bromley
136
-7%
0
-1
0
Camden
61
-8%
0
-4
0
City of London
5
0%
0
0
0
Croydon
180
-5%
0
-4
0
Ealing
534
-4%
-1
-4
3
Enfield
486
-7%
-2
-5
3
Greenwich
240
-21%
-3
-1
3
Hackney
74
-14%
-1
-4
0
Hammersmith and Fulham
172
-23%
-2
-7
3
Haringey
167
-14%
-1
-2
2
Harrow
71
-20%
-1
-1
1
Havering
510
-7%
-2
-13
1
Hillingdon
430
-6%
-1
-7
3
Hounslow
496
-3%
-1
-3
1
Islington
70
-7%
0
-5
0
Kensington and Chelsea
28
-7%
0
-2
0
Kingston upon Thames
116
-6%
0
0
0
Lambeth
96
-8%
0
-4
1
Lewisham
135
-25%
-2
-6
1
Merton
177
-5%
0
-2
0
Newham
563
-19%
-5
-3
3
Redbridge
72
-15%
-1
-1
0
Richmond upon Thames
48
-8%
0
-2
0
Southwark
170
-15%
-1
-5
0
Sutton
334
-3%
0
0
1
Tower Hamlets
180
-19%
-2
-4
3
Waltham Forest
214
-13%
-1
-3
1
Wandsworth
179
-23%
-2
-6
2
Westminster
19
-5%
0
-2
0
Projected population growth in London
Employment growth 2011-31
% employment growth 2011-31
Projected population growth 2011-31
Population growth 2011-31
Barking and Dagenham
-1,000
-2%
71,920
38%
Barnet
32,000
23%
100,767
28%
Bexley
11,000
15%
39,076
17%
Brent
27,000
24%
58,536
19%
Bromley
23,000
20%
63,943
21%
Camden
77,000
24%
56,112
25%
City of London
93,000
22%
3,479
47%
Croydon
-19,000
-14%
74,513
20%
Ealing
16,000
11%
57,656
17%
Enfield
21,000
20%
75,066
24%
Greenwich
16,000
20%
59,286
23%
Hackney
34,000
31%
65,611
27%
Hammersmith and Fulham
42,000
30%
16,170
9%
Haringey
14,000
19%
58,199
23%
Harrow
16,000
22%
51,013
21%
Havering
14,000
18%
52,747
22%
Hillingdon
58,000
29%
77,815
28%
Hounslow
46,000
32%
70,099
27%
Islington
86,000
44%
60,154
29%
Kensington and Chelsea
32,000
24%
3,897
2%
Kingston upon Thames
7,000
9%
36,426
23%
Lambeth
48,000
33%
61,247
20%
Lewisham
16,000
22%
64,752
23%
Merton
29,000
35%
38,767
19%
Newham
45,000
52%
92,375
30%
Redbridge
22,000
30%
83,718
30%
Richmond upon Thames
14,000
15%
39,368
21%
Southwark
113,000
48%
63,678
22%
Sutton
5,000
7%
48,084
25%
Tower Hamlets
185,000
75%
103,223
40%
Waltham Forest
24,000
34%
66,065
25%
Wandsworth
31,000
26%
47,780
15%
Westminster
150,000
23%
59,216
27%
• To send feedback, e-mail amber.rolt@estatesgazette.com or tweet @amberrolt or @estatesgazette
With the DEI narrative shifting and companies and politicians stepping back from their previous commitments, it is more important than ever for those in the LGBTQIA+ community and their allies…