

Despite political uncertainty around the world, there are still plenty of cities showing good prospects for investors – and Europe looks like the best bet
The weight of capital in the global real estate market should offset investor concerns around geopolitical instability, says data firm Real Capital Analytics.
A list of the 20 top cities for cross-border investment between Q2 2016 and Q1 2017 shows that strong, liquid European cities are proving particularly attractive for overseas buyers looking for safe haven markets, despite political uncertainty.
London, Paris, Amsterdam, Berlin and Dublin all feature in the top 10 cities by cross-border investment with Frankfurt, Munich and Prague making the top 20 list.
Top 20 metros for cross-border investment, Q2 16-Q1 17
|
Rank |
Metro |
Investment volume ($m) |
|
1 |
NYC Metro |
17,297 |
|
2 |
London Metro |
16,118 |
|
3 |
Paris |
8,526 |
|
4 |
Amsterdam |
6,814 |
|
5 |
San Francisco Metro |
5,820 |
|
6 |
Berlin-Brandenburg |
5,548 |
|
7 |
Dublin |
5,254 |
|
8 |
Singapore |
4,972 |
|
9 |
Sydney |
4,761 |
|
10 |
Washington DC Metro |
4,569 |
|
11 |
Los Angeles Metro |
4,366 |
|
12 |
Seoul |
4,181 |
|
13 |
Shanghai |
3,794 |
|
14 |
Rhine-Ruhr |
3,763 |
|
15 |
Frankfurt |
3,542 |
|
16 |
Melbourne |
3,501 |
|
17 |
Munich |
3,269 |
|
18 |
Prague |
3,011 |
|
19 |
Chicago |
2,872 |
|
20 |
Boston Metro |
2,809 |
Source: Real Capital Analytics
Tom Leahy, senior director EMEA at RCA, says that fears over uncertainty are unlikely to derail these top-performing cities much over the coming 12-24 months, particularly in Europe. “There was a slowdown in France in Q1 ahead of the election,” he says. “But that was a short-term issue. Now that wouldn’t be perceived to be a risk in the French market at all.
“In the US and beyond, the risk around what Donald Trump does next is probably at the forefront of investors’ minds. But there is such weight of capital in the market it outweighs the majority of worries and concerns.”
Leahy adds that the large number of European cities in the top 20 league is a result of looking at global cities by cross-border investment in isolation. “European markets are much more dominant on a list of cities by investment when we just look at cross border as they usually have a fairly even split of domestic and overseas investment,” he says. “In the US, cross border makes up only 10-15%. So while you have these very big markets and cities, a lot of that is fuelled by domestic money.”
Top 10 growth cities, Q1 2017 vs Q1 2012
|
Metro |
Q1 2012 ($m) |
Q1 2017 ($m) |
Growth |
|
Dublin |
161 |
6,374 |
3,866% |
|
Madison, WI |
42 |
764 |
1,736% |
|
Athens |
35 |
588 |
1,604% |
|
Hawaii |
154 |
1,347 |
774% |
|
New Haven |
129 |
746 |
478% |
|
Shenzhen |
565 |
3,216 |
469% |
|
Charleston |
235 |
1,139 |
385% |
|
Mumbai |
340 |
1,651 |
385% |
|
Wuhan |
210 |
937 |
347% |
|
Madrid |
1,952 |
8,709 |
346% |
Source: Real Capital Analytics
Bottom 10 growth cities, Q1 2017 vs Q1 2012
|
Metro |
Q1 2012 ($m) |
Q1 2017 ($m) |
Growth |
|
Taipei |
3,357 |
1,046 |
-69% |
|
Saint Petersburg |
1,547 |
548 |
-65% |
|
Moscow |
6,645 |
2,738 |
-59% |
|
Perth |
2,034 |
954 |
-53% |
|
Johannesburg |
2,392 |
1,283 |
-46% |
|
Kawasaki |
1,094 |
614 |
-44% |
|
Guangzhou |
1,332 |
760 |
-43% |
|
Edmonton |
2,302 |
1,409 |
-39% |
|
Glasgow |
1,169 |
739 |
-37% |
|
Ottawa |
1,249 |
809 |
-35% |
Source: Real Capital Analytics
While London and New York remain streaks ahead of their nearest rivals, Leahy highlighted Amsterdam – which saw a total investment of $6.8bn over the period – as a market to watch: “Amsterdam is interesting. The Dutch market has seen a big growth in interest because prices are still below where they were in 2007. This is one of the few places in Europe where this is still the case. So, some value-add players are eyeing the market as well as some of the big Asian pension funds.”
In terms of fastest-growing markets, he points to Dublin, which saw a 3,866% leap in investment between Q1 2012 and Q1 2017, and Shenzhen, which saw a 469% jump. “The latter is particularly interesting,” he says. “It points to a growing maturity in the Chinese market in terms of income-producing investment. With a near 500% increase in investment, you can see how fast things are moving and it could have a knock-on effect on cities such as Mumbai.”
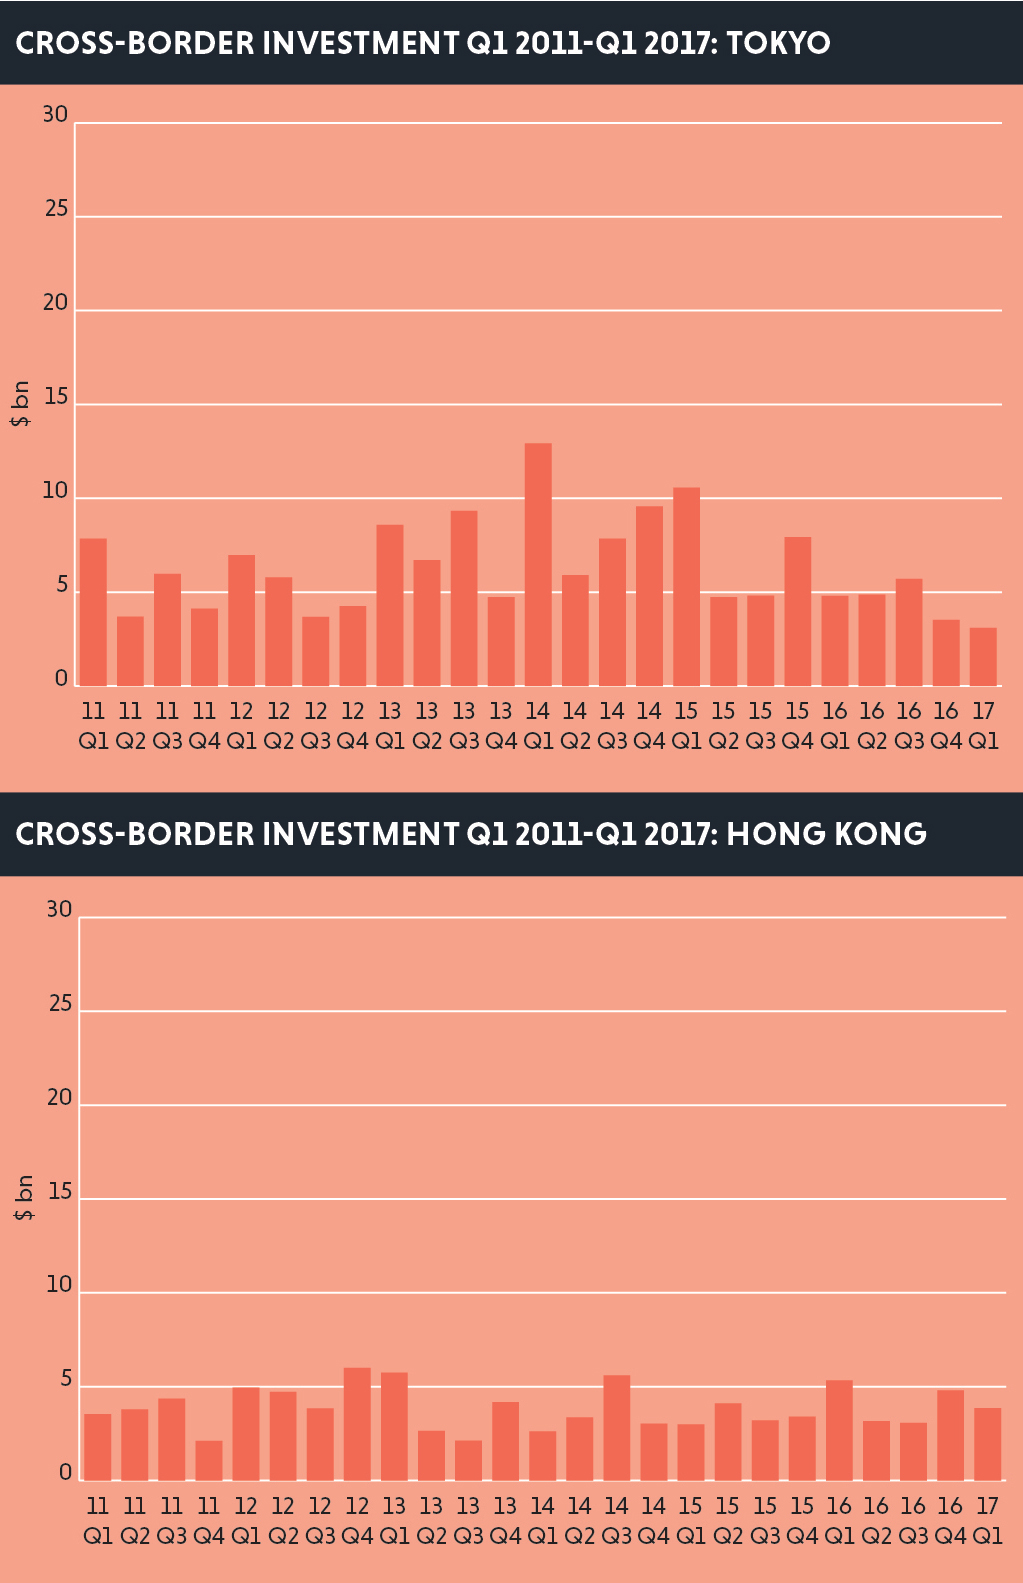
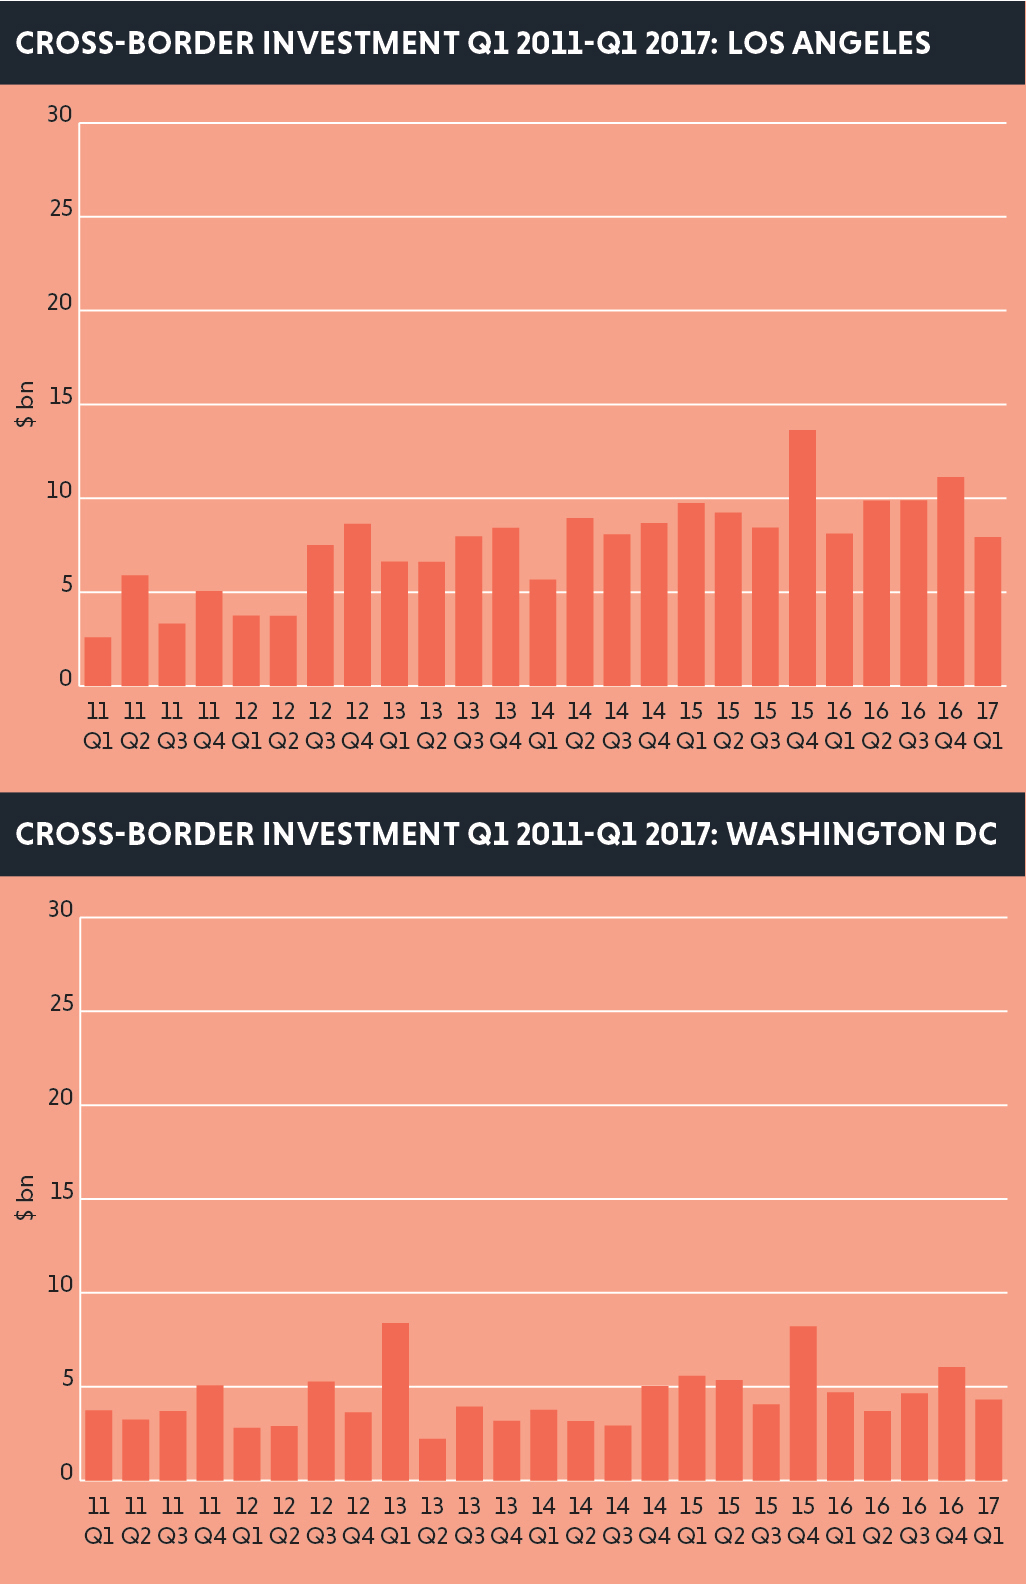
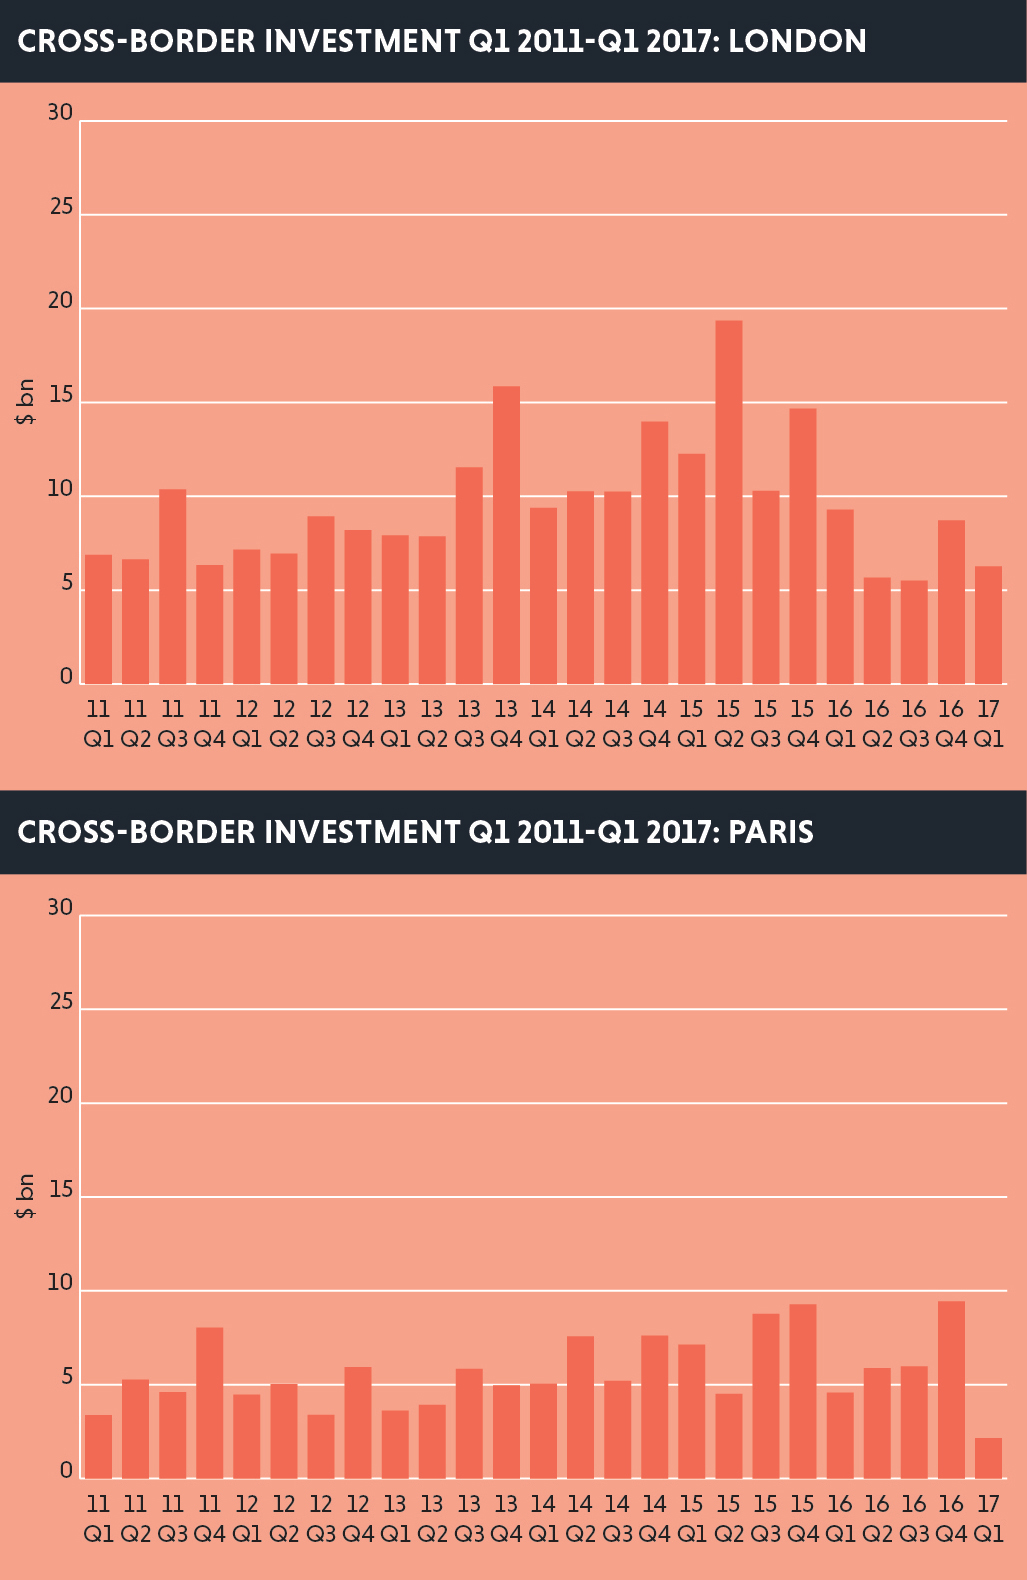
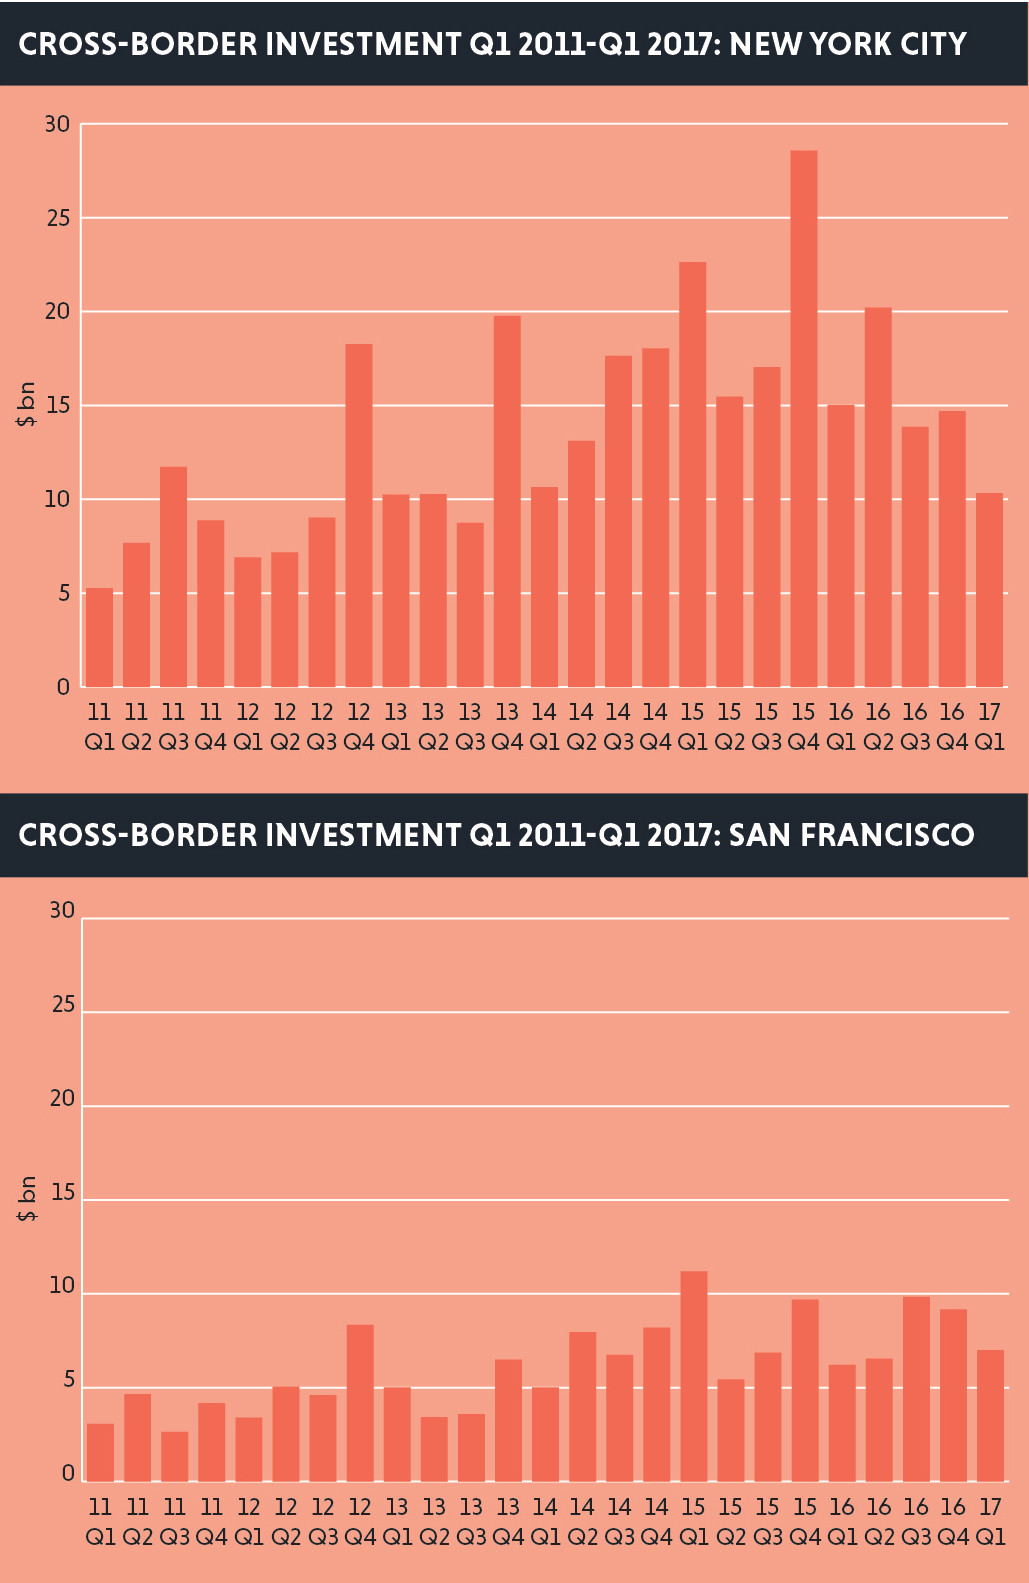
Deeper analysis of cross-border investment into eight global cities over the past seven years almost universally reveals a spike in investment in 2015, with varying levels of drop-off in the 18 months since (see graphs below). But Leahy says, once again, this pattern should not concern investors too much, putting it down to an anomalous year. “People forget that 2015 really was an exceptional year for overseas investment,” he says. “That doesn’t mean there is a dearth of capital now. There is still a huge volume. You almost can’t compare that year with the others.”