

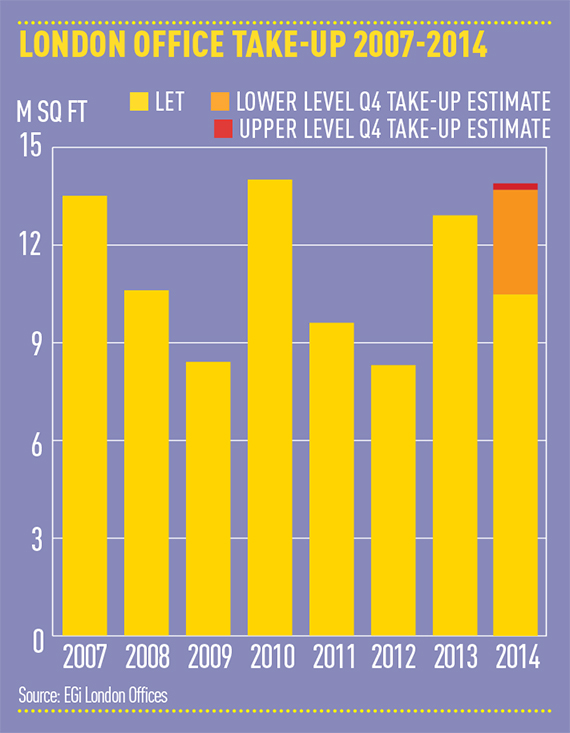
At the end of Q2, I made the assessment that London office take-up for 2014 would be good rather than spectacular and, as such, 2014 would not be sitting alongside the great years of 2007 with 13.5m sq ft let or 2010 with 14m sq ft let. The third quarter of this year brought with it 4.4m sq ft of take-up and the need to reconsider that assessment.
By the end of the third quarter in 2007, take-up sat at around 11m sq ft and at the same point in 2010, it was just under 10m sq ft. At the end of Q3 2014, take-up sits right between those peaks at 10.5m sq ft, which suggests that the year-end figure could sit comfortably with these two years. But what will the year-end figure be?
Three methods can be used to forecast the Q4 2014 take-up figure. The first is to look at the amount of space under offer, which currently stands at 3.4m sq ft. If we make a very basic assumption that all that space is let in Q4 and there will be no other deals beyond this, then we end up with take-up for the year of 13.9m sq ft, putting it in the bracket of the spectacular years.
Another way to look ahead is to consider the level of active demand in the market in a particular quarter and the percentage of that which is let in the next. Going back over the last three quarters, the average percentage of active demand that was let the following quarter was 35%. If we were to apply that 35% figure to Cushman & Wakefield’s current level of active demand, which stands at 9.2m sq ft, then we get Q4 lettings of 3.2m sq ft.
This method therefore gives a year-end take-up figure of 13.7m sq ft. Coincidentally, that figure is also the same as that obtained if the Q4 five-year quarterly take-up figure is calculated and added to the year-to-date total.
Three different methods used to calculate the Q4 take-up figure and a good level of consensus between the three, so I will put my head on the block and state that take-up for 2014 will come in between 13.7m sq ft and 13.9m sq ft.