

In April, when the sun was mercifully dormant and only the bravest soul would venture out in a Marks & Spencer’s waistcoat, London’s office market had started the year steadily but unspectacularly.
Three months on, and nascent elements of the spectacular have begun to emerge.
Healthy occupational activity across the capital in the second quarter of the year has pushed the 12-month rolling take-up above 13m sq ft for the first time in two-and-a-half years.
Grade-A rents have showed annual growth for the first time since the Brexit referendum in 2016, and a subdued Q1 investment market has come to life, with overall quarterly spend eclipsing £4.5bn – a larger total than in eight out of the last nine quarterly periods.
But, while the headline stats appear to reveal a market continuing to show remarkable resilience in the face of mind-boggling political lockjaw, are those spectacular elements shrouding any struggles as we hurtle relentlessly towards our March 2019 divorce date with the EU?
| Take-up | Take-up by sector |
| Construction | Rents |
| Availability | Investment |
| Agent league tables | Investment league table |
TAKE-UP
Occupational renaissance?
Figures from Radius Data Exchange indicate that 3.4m sq ft was let in London during Q2, representing a 13% increase on the same period last year, and an increase on the five-year and 10-year averages of 5% and 18% respectively.
Of critical importance to this was the Chinese Embassy’s deal to take more than 580,000 sq ft at the yet-to-be-built Royal Mint Quarter, EC3, paying a premium of more than £200m to acquire the pre-development space, and helping the City core market reach take-up levels exceeding the five-year average by 53%.
This is the second time in as many years that a significant transaction from the Far East has helped boost the London Office market in Q2.
June 2017 saw the completion of Hong Kong-based CC Land’s £1bn-plus deal for the Cheesegrater, EC3, which accounted for 33% of the total London office investment in that quarter – and that level of influence over the statistics was exerted again, this time by the Chinese government.
The Embassy deal alone represents 17.3% of London’s overall office take-up across Q2 – one of the largest proportions for a single deal in a given quarter. Over the last five years, only Google’s mammoth 860,000 sq ft deal at King’s Cross, N1, in the opening three months of 2013 shows a larger percentage, at 32.5%.
Therefore, while the headline figures (and City core stats) appear strong, a closer look under the bonnet shows that things aren’t uniformly outstanding.
Four out of the six main submarkets show a decrease on five-year take-up averages, with only the West End joining the City core in showing a positive trend. The Southern fringe suffered most acutely, with figures indicating a 73% drop against the same period in 2017, and a 51% drop on the five-year quarterly average.
The third-best performing submarket was the City fringe, which saw 417,000 sq ft transact between April and June – a 91% increase on the previous quarter, but still 4% below the five-year average, which stands at 435,000 sq ft.
British Land’s head of offices, Tim Roberts, is bullish about London’s long-term prospects and continued appeal to businesses, no matter what happens next year.
He says: “Businesses don’t have time to wait until everything is known – they have to make long-term commitments, and over the long term London is still a place that is going to have competitive advantages over other cities in the world. Occupiers understand that London’s still got a lot to offer them.”
Take-up drivers by sector
The Chinese Embassy deal again made its presence felt in the take-up by sector analysis, with government bodies accounting for 19.9% of activity in Q2 – just marginally pipping the serviced office sector, which accounted for 19.7% of take-up.
TMT found itself in an unfamiliar third place, with just 16.8% of occupiers taking new space in London this quarter falling into the tech sector.
This is the first time that TMT operators do not fill one of the top two slots for driving take-up since Q4 2016, when another large government deal – the GPU at South Colonnade, E14 – dominated the statistics.
There has already been a fightback from tech in Q3, in the shape of Facebook’s 600,000 sq ft deal at King’s Cross earlier this month – which most likely means we will be crowning TMT as the king of occupier sectors once again next quarter.
Two elements which proved vitally important to London take-up back in Q1 once again came through to boost occupational volumes between April and June – transactional volume and development space.
Overall deal volumes hit 384 in Q2 – the seventh consecutive quarter in which more than 350 deals were struck, and the longest such streak since EG began tracking the market – making it the second-busiest Q2 on record after Q2 2015, which saw 446 deals completed.
Along with the pre-development space at Royal Mint Quarter, deals for units currently under construction at Canalside Walk, W2, and 1 Finsbury Avenue, EC2, mean that 32% of overall take-up so far in 2018 is for office space which is either currently being built, or has not yet started.
Such is the accelerating demand for new-build quality space that occupiers are now planning further and further in advance to snatch up the space before they are beaten to the punch, according to head of leasing at Derwent London, Emily Prideaux.
She says: “It’s certainly a sign of a trend that people are educated sooner, and being advised by the occupier teams that they need to be out looking earlier. Companies are looking three or four years in advance. It’s quite a new phenomenon in the market that has come about over the last 18 months.”
If this percentage is maintained throughout the year it will represent the highest proportion of London take-up attributed to development space over the past decade – with the closest being 29% in 2008. Facebook’s mammoth pre-construction deal agreed at the beginning of Q3 will only accelerate this possibility – but with these units flying off the shelves, are we heading towards a supply crunch for new space?
Holding back?
Clearly there is some folly behind ‘build it and they will come’, given the latent uncertainty which still hovers around Britain’s imminent divorce from and future business relationship with the EU.
But given how well those development spaces are letting, it is lamentable that an exacerbation of a 10-year long trend has continued this quarter, with availability of pre-development space hitting a decade low of 7m sq ft at the end of Q2.
This is partially explainable by the fact that a single deal of over 580,000 sq ft has skewed that figure, but Radius Data Exchange planning data indicates that there is 16.6m sq ft of office space sitting at permission across central London – meaning there would surely have been enough to fill the vacuum created by the letting at Royal Mint Court, had there been the desire to bring the space to market.
That desire doesn’t look as if it will be showing any time soon, however, as BL’s Roberts explains: “I would err on the side of saying that I don’t think the supply pipeline will respond strongly to this uptick in demand. It feels to me that at the moment the market is nicely balanced as long as you’re in the market of good central London property.”
Something which should be encouraging to those sitting on permissions for new stock is that consensus rental data from EG’s panel of agency experts indicates both a quarterly and annual rise for grade-A space across London – the first time that both metrics have shown positive growth since Q2 2016.
A London-wide increase of 0.3% was helped by substantial rises in Euston and Paddington, helping to offset annual falls in the prime areas of Mayfair and Victoria in the West End, and in Canary Wharf in Docklands.
One usually expects rental growth to be propelled, at least partially, by increased scarcity, but on this occasion that is not the case – the availability rate has moved slightly outwards across London, from 7% to 7.1%.
This is partially due to second-hand Grade B stock experiencing greater churn than it has done previously, with vacations in this type of space impacting the market slightly more than the weight of take-up in the pre-marketing and under construction category.
While development space has become critically important to London’s office demand in recent years, Grade B stock appears to be waning in appeal. Transactional data from the last four years shows a widening gap in average rent-per-sq-ft values between these development units and Grade B supply.
This isn’t necessarily to say that landlords of secondary assets should panic, but rather assess the options available to them – particularly those holding larger assets.
Head of City agency at Knight Frank, Dan Gaunt, says: “The secondary market is a massive opportunity, if the buildings are of scale and can undergo a thoughtful refurbishment that reflects occupiers’ needs. If they are smaller, they are more challenging. Rents will suffer due to the effect of co-working, which is having an impact on the sub-10,000 sq ft market, whereas the bigger buildings do not suffer from that competition.”
READ MORE: Can struggling Docklands be revitalised?
However, there is also an issue of simple geographical disparity in the scarcity data, as availability rate figures for the Docklands submarket indicate that the supply rate in E14 has moved outwards from 10.3% at the end of Q1 to 12% now. This is thanks largely to a further 200,000 sq ft of second-hand stock coming onto the Docklands market between April and June.
If we strip Docklands away from the rest of Central London, it would actually mean the market has shown increased scarcity.
While Docklands has shown some ‘bouncebackability’ in take-up so far this year after a subdued 2017 (370,000 sq ft let in the first half of 2018 compared with just 79,000 sq ft at this stage last year), there clearly remain some underlying issues on the occupational front – and the question should be asked as to whether competing on price and offering a Crossrail link will be enough to propel Docklands to future growth.
INVESTMENT
Big spenders
Radius Data Exchange records just over £4.5bn transacted in Q2 – representing a 67% increase on the first quarter, and a 32% increase on the same period last year.
These figures mean that H1 investment totalled £7.2bn – beaten only in the last five years by 2015, which saw £8.5bn change hands.
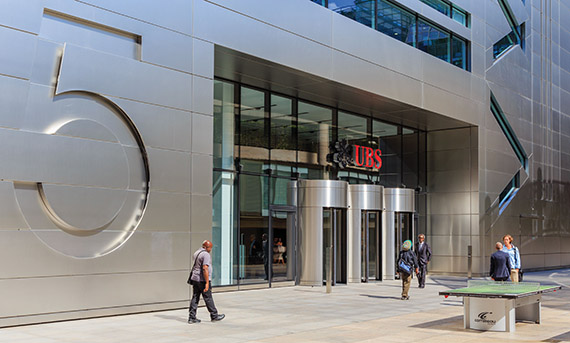
Similar to take-up, the City core is the stand-out performer here, attracting £2.7bn of the total – of which £2bn came through in June alone as buyers flocked to the Square Mile to pick up assets such as 5 Broadgate, EC2, 25-28 Ropemaker, EC2, and 70 Mark Lane, EC3, just before the traditionally quieter summer months.
Four out of the five largest deals were to Chinese, Singaporean and Korean investors, with those four accounting for £2.2bn (48%) of the overall spend – mirroring a recent trend of large lot sizes having a sharper impact on overall investment volumes.
Adam Goldin, head of UK at CC Land, says: “London is changing in terms of the developments that we’re seeing today. These huge lot sizes didn’t really exist in London 15 years ago and so we can say these are distorting figures, but actually it’s a reflection of how the landscape of London has changed.
“We will continue to see a churn of these large assets, maybe not in every quarter, but throughout the year.”
The figures may even have looked even stronger were it not for a few sales that didn’t quite get over the line as a result of pricing expectations not quite being met.
“When genuinely iconic buildings like the Cheesegrater, the Walkie Talkie and 5 Broadgate are marketed, you’re going to get significant overseas capital chasing these opportunities,” says Goldin.
“The vendors who own assets on the rung below have mistakenly looked to these deals as comparable for their own assets and have felt that they can benefit from the premium prices being paid, ignoring the discerning nature of overseas capital.
“It’s this middle area in between £100m and the really premium buildings where there’s been high aspirations which have not necessarily married up with the appetite from foreign capital.”
David Silverman, director at Derwent London, also touches on the specificity involved with being able to attract stellar pricing for London office products, but also the lack of panic for those landlords unable to sell.
“I think that assets need to tick the right box to really achieve top pricing, but one of the things that has been the case for a long time is that there is no distress out there,” he says. “So if buildings are not reaching the prices, people are happy just to hold on to it.”
AGENT LEAGUE TABLES
Overall leasing
Knight Frank took top spot for London disposals – with its involvement in the two largest deals of the quarter – both in the City core.
The letting at Devonshire Square, EC2, to WeWork added to the Royal Mint Court deal, to account for more than 700,000 sq ft of its 970,000 sq ft total, which gave it an overall market share of 26.4% as it ascended to the summit from fourth place in Q1.
BH2 also advised on the Chinese Embassy deal, as well as disposing of 83,000 sq ft at One Canada Square, E14, to the Office Group, and 58,500 sq ft to Charles Taylor at the Minster Building, EC3. This helped it to reach second place, up from sixth last time.
A notable mover was Ingleby Trice, which climbed from 37th place in Q1 to 11th in this quarter’s table, thanks to its 54,000 sq ft disposal to the Trade Desk at Barts Square, EC1, alongside Savills and CBRE.
Colliers International struck the most individual deals this quarter with 70 – 19 more than nearest rivals CBRE and Cushman & Wakefield, both of which advised on 51 transactions.
Submarkets
Given the aforementioned significance of the two large City deals to the overall league table, it comes as little surprise to see Knight Frank top the disposals list for the submarket, in which it advised on over 820,000 sq ft.
Cushman’s 19 individual deals, totalling 282,000 sq ft, were enough to come in third, behind BH2, which acted on two large deals at the Minster Building, EC3, to supplement its joint disposal of the Chinese Embassy.
Colliers’ dominance in the City fringe continued in Q2 – the firm secured its fourth consecutive victory in this submarket by acting on 31 individual deals totalling over 150,000 sq ft.
Largest among them was the 30,000 sq ft deal for Farfetch UK at 207 Old Street, EC1, which it jointly disposed with second-placed JLL.
Gryphon Property Partners and Hall Kemp broke into the top five by virtue of their joint disposal of the biggest City fringe deal this quarter to WeWork at 70 Wilson Street, EC2.
CBRE secured a mammoth 97% market share in the Docklands, acting on three large transactions at One Canada Square, 40 Bank Street, and Clove Crescent, all E14, to top the table with just under 135,000 sq ft of disposals.
Colliers booked its second submarket victory of the quarter, taking a 33% market share in Midtown with more than 116,000 sq ft of landlord space disposed.
It acted on the two largest deals in the market this quarter, letting 37,000 sq ft to the Office Group at Orion House, WC2, jointly with BNP Paribas Real Estate; and the same amount to Spaces at 65-70 White Lion Street, N1 – which it jointly disposed with fifth-placed Levy.
Union Street Partners jumped to the top of the South Bank table this quarter for the first time since Q3 2017, securing a 51% market share through its 69,000 sq ft of disposals across 15 individual deals in what was a quiet quarter overall for the submarket.
Key to its success was the 12,000 sq ft letting to Broadway Malyan at Holmes House, SE1, in addition to Ridge & Partners taking 9,000 sq ft at 3 Valentine Place, SE1.
CBRE came out on top in the West End for the first time since Q3 2017, taking a 38% market share through its 345,000 sq ft of disposals – which came through 29 individual deals, a higher volume than any otheragent.
Sony Pictures’ 77,200 sq ft deal at Canalside Walk, W2, was the largest West End deal this quarter – a CBRE and Cushman & Wakefield joint disposal; but it was the second-largest deal which was key to CBRE’s success, as it let 57,000 sq ft to KKR at 18 Hanover Street, W1.
Investment
Having advised on over £2bn of transactions in Q2, CBRE take top spot in the investment league table with a 29% market share.
It advised on the largest deal this quarter – the £1bn sale of 5 Broadgate, EC2 – as well as acting alongside second-placed Cushman & Wakefield on the disposal of 20 Old Bailey, EC4.
JLL and Eastdil Secured also placed highly thanks to their involvement in the second-largest deal of the quarter at 25-28 Ropemaker Street, EC2.