

Tech start-ups face the highest costs in London, New York and San Francisco, while emerging international tech hotspots will see the highest rental growth until the end of 2019, as companies look establish themselves near the largest pools of creative talent, according to Knight Frank’s 2017 Global Cities report.
 The report shows Sydney on top with rents forecast to increase by 27.5% over the period, followed by Berlin, Austin and Madrid which are all set to experience growth of more than 20%.
Rental growth will be less distinct in mature markets such as London (7.1%) and San Francisco (5.1%), and cities where there is still a bias towards financial services, such as Hong Kong (4.5%) and Frankfurt (3.9%).
Rental growth for tech start-ups
| Ranking | Growth % |
|---|---|
| Sydney | 27.5 |
| Berlin | 25 |
| Austin | 24.9 |
| Madrid | 21 |
| Melbourne | 19.3 |
| Shanghai | 19.2 |
| Seattle | 17 |
| Los Angeles | 15.9 |
| Dublin | 15.5 |
| Boston | 11.1 |
| Mumbai | 11.1 |
| Tokyo | 10.3 |
| Paris | 10 |
| Bangkok | 8.3 |
| London | 7.1 |
| Amsterdam | 6.8 |
| Miami | 6 |
| San Francisco | 5.1 |
| Washington, DC | 5 |
| Hong Kong | 4.5 |
Tech start-ups also face the highest costs in London, New York and San Francisco, according to the report, which has examined the cost of leasing and fitting-out 600 sq ft of office space in digital hubs around the world.
Demand for space in Shoreditch, London, has seen a spike in start-up office costs with 600 sq ft of office space to cost $66,706 (£50,374) ( per year – the highest of any creative district in the world.
This is followed by Brooklyn in New York ($62,736), Mid-Market in San Francisco ($61,680), first, second and ninth districts in Paris ($57,426) and the Seaport District in Boston ($50,700).
Emerging tech and digital districts, such as Silicon Docks in Dublin and the Domain in Austin, offer lower start-up costs at $47,345 and $35,280 respectively.
But the research also shows Shoreditch offers the greatest cost saving for tech businesses that opt to locate in co-working spaces. The cost of occupying four desks in a co-working space in Shoreditch is $28,933 per annum, a saving of $37,773, or 57%, versus traditional office space.
Start-up costs in global cities
| Ranking | City | District | Own office cost pa | Co-working provider pa | Cost saving pa |
|---|---|---|---|---|---|
| 1 | London | Shoreditch | $66,706 | $28,933 | $37,773 |
| 2 | New York | Brooklyn | $62,736 | $28,800 | $33,936 |
| 3 | San Francisco | Mid-Market | $61,680 | $24,000 | $37,680 |
| 4 | Paris | 1st, 2nd and 9th Districts | $57,426 | $21,276 | $24,780 |
| 5 | Boston | Seaport District | $50,700 | $25,920 | $36,150 |
| 6 | Dublin | Docklands | $47,345 | $34,577 | $12,768 |
| 7 | Los Angeles | Playa Vista | $47,124 | $27,600 | $19,524 |
| 8 | Hong Kong | Cyberport, Pokfulam | $40,488 | $40,635 | -$147 |
| 9 | Beijing | Zhongguancun | $39,090 | $10,111 | $28,979 |
| 10 | Singapore | One North | $39,088 | $23,105 | $15,983 |
James Roberts, chief economist at Knight Frank, said: “As we head towards Brexit, tech start-ups are the sort of firms the UK will be looking to for future growth. So it is disappointing to discover London is such an expensive place for them to rent business space, at least if they want their own offices.”
James Nicholson, partner, Knight Frank tech, added: “This study illustrates that co-working has an important role to play in supporting the next generation of innovative tech companies early in their life cycle. These businesses are highly mobile, and mature markets such as Shoreditch and Brooklyn – having worked so hard to cultivate tech clusters – risk being overtaken by other locations if they cannot provide affordable workspace.”
The report also shows office yield spread has broadened as government bond yields fall to historic lows and yields on property have risen, with the widest spread noted in Brussels at 4.78%, London comes ninth on the list at 3.53%.
Top 10 yield spreads in global cities
| City | Yield spread | 10-year govt bond yield | Office yield |
|---|---|---|---|
| Brussels | 4.78 | 0.22 | 5 |
| Amsterdam | 4.68 | 0.07 | 4.75 |
| Frankfurt | 4.3 | -0.05 | 4.25 |
| Berlin | 3.95 | -0.05 | 3.9 |
| Zurich | 3.71 | -0.46 | 3.25 |
| London | 3.53 | 0.72 | 4.25 |
| Tokyo | 3.42 | -0.02 | 3.4 |
| Sydney | 3.35 | 1.93 | 5.28 |
| Milan | 3.32 | 1.18 | 4.5 |
| Paris | 3.06 | 0.19 | 3.25 |
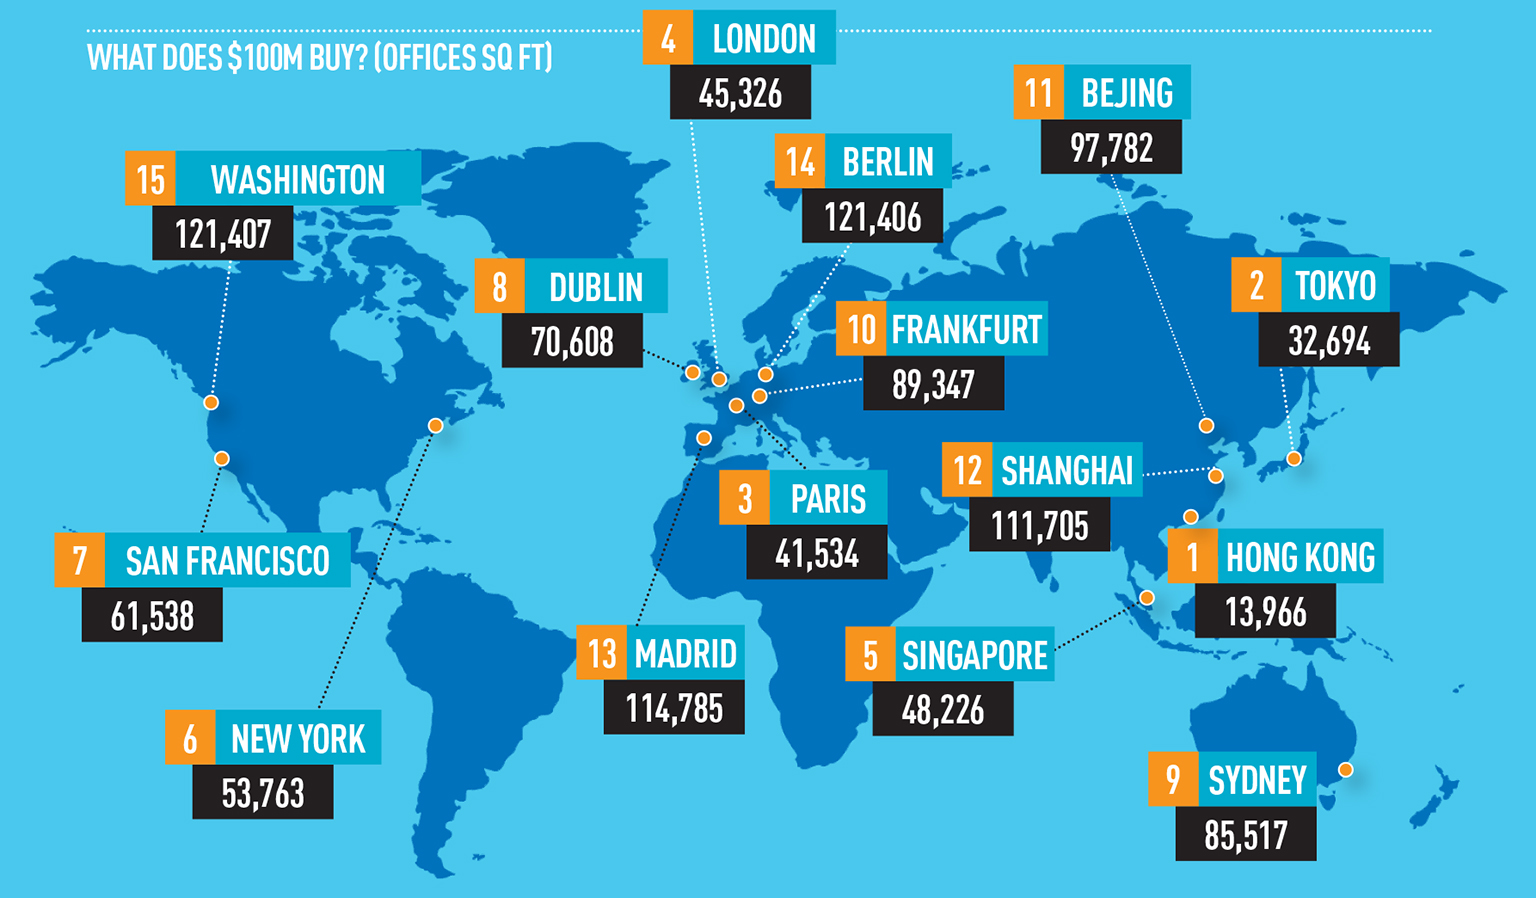
Examining rents of commercial buildings over 30 storeys, Hong Kong’s skyscrapers are the priciest at $278.50 (£209) per sq ft. London, at $114, per sq ft comes fifth on the list. Hong Kong is also the most expensive investment location – $100m will buy 14,000 sq ft of commercial space.
Prime office rents for upper floors in skyscrapers
| Ranking | City | Rent ($/sq ft/pa) | % growth in six months to Q2 2016* | Rent ($/sq m/pa) |
|---|---|---|---|---|
| 1 | Hong Kong | $278.50 | 5.9% | $2,996.44 |
| 2 | New York (Manhattan) | $158 | 1.9% | $1,700.70 |
| 3 | Tokyo | $149.50 | 0% | $1,610.27 |
| 4 | London (City) | $114 | 0% | $1,225.55 |
| 5 | San Francisco | $113 | 2.7% | $1,216.32 |
| 6 | Sydney | $90.75 | 6.6% | $976.82 |
| 7 | Boston | $77 | 0% | $828.82 |
| 8 | Singapore | $72 | -7% | $774.79 |
| 9 | Shanghai | $72 | 7.6% | $774 |
| 10 | Beijing | $63 | 3.3% | $678.04 |
• To send feedback, e-mail Shekha.Vyas@estatesgazette.com or tweet @shekhaV or @estatesgazette