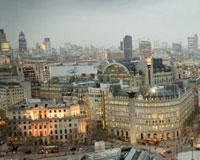
London’s West End has retained its title of the highest-priced office market in the world.
The West End’s overall prime occupancy costs of $274 (£174.4) per sq ft means the area ranks number one in CBRE Research’s Global Prime Office Occupancy Costs survey.
City of London costs of $152.7 per sq ft made it number eight in the list.
However, Asia dominated the world’s most expensive office locations, accounting for three of the top five markets.
Ireland’s Dublin office market has seen the fastest rate of occupancy growth, with prices increasing by nearly 40%.
Stewart Smith, executive director, central London tenant advisory group, at CBRE, said: “We reported last year that the West End had unseated Hong Kong as the world’s most expensive office market, a trend that has continued throughout 2014.”
Top 50 most expensive office markets
Rank (Q3 2014)
Market
Cost ($psf)
Rank (Q1 2014)
1
London West End, UK
273.63
1
2
Hong Kong (Central), Hong Kong
250.61
2
3
Beijing (Finance Street), China
197.75
3
4
Beijing (CBD), China
189.39
4
5
Moscow, Russian Federationn
165.05
5
6
New Delhi (Connaught Place – CBD), India
158.47
8
7
Hong Kong (West Kowloon), Hong Kong
153.65
6
8
London City, UK
152.67
7
9
Tokyo (Marunouchi Otemachi), Japan
136.46
9
10
Shanghai (Pudong), China
127.89
12
11
New York (Midtown Manhattan), US
120.65
11
12
San Francisco (Downtown), US
114.00
15
13
Paris, France
113.95
10
14
Singapore, Singapore
112.91
18
15
Shanghai (Puxi), China
112.14
14
16
Mumbai (Bandra Kurla Complex), India
103.52
16
17
Seoul (CBD), South Korea
102.55
20
18
Rio de Janeiro, Brazil
101.34
13
19
Sydney, Australia
99.06
17
20
Boston (Downtown), US
96.25 22
21
Geneva, Switzerland
93.83
19
22
Seoul (Yeouido), South Korea
92.84
24
23
Dubai, United Arab Emirates
92.56
23
24
São Paulo, Brazil
91.78
21
25
Washington DC (Downtown), US
87.61
26
26
Zurich, Switzerland
84.10
25
27
Los Angeles (Suburban), US
83.62
30
28
New York (Downtown Manhattan), US
82.55
29
29
Jakarta, Indonesia
81.81
31
30
Istanbul, Turkey
81.44
28
31
Perth, Australia
77.02
27
32
Mumbai (Nariman Point – CBD), India
76.57
32
33
Edinburgh, UK
73.76
34
34
Aberdeen, UK
73.35
35
35
Manchester, UK
73.35
36
36
Guangzhou, China
73.21
38
37
Dublin, Ireland
73.00
48
38
San Francisco (Peninsula), US
72.57
46
39
Birmingham, UK
71.32
39
40
Stockholm, Sweden
70.88
33
41
Bristol, UK
70.51
40
42
Glasgow, UK
70.51
45
43
Oslo, Norway
68.30
44
44
Taipei, Taiwan
67.99
47
45
Milan, Italy
67.71
37
46
Brisbane, Australia
67.43
43
47
Leeds, UK
65.65
49
48
Ho Chi Minh City, Vietnam
65.35
42
49
Frankfurt, Germany
65.12
41
50
Mexico City, Mexico
62.48
51
Source: CBRE Global Research and Consulting
joanna.bourke@estatesgazette.com


 London’s West End has retained its title of the highest-priced office market in the world.