


Two ignition points should be troubling London office agents: rental growth, or lack of it; and the slow retrenching of the banks from the capital’s markets.
At the start of 2016 we saw the brakes being slowly applied on rental growth after seven consecutive quarters of around 2% quarter-on-quarter growth. Over Q2 and Q3 in the lead up to and aftermath of the Brexit vote, for the first time in many years across-the-board rental growth dipped into negative territory before flatlining by the end of the year.
And then there were the banks. Finance firms represented a third of all space vacated in London in 2016. This year nearly 20% of floorspace across London’s submarkets is at risk of tenant vacation.
This raises the question of how exposed London markets are to rental contraction. Also, with the growth of co-working space and businesses looking to reduce their footprints, which market will be most affected?
The risk of damage to rents by potential over-supply may be mitigated by the still relatively conservative overall supply, which stands at 28% below 2007 levels. Back then this caused 2008 and 2009’s availability rate to increase to 10.2% and caused rents to drop by 19%.
The reliance of the City core and Docklands on the financial sector appears to put these two markets most at risk of rental contraction, with financial business occupying 39% of space in the City core and 58% in Docklands. Add to this the fact that for the first time since 2012 the financial sector made up the highest proportion of vacations, at 33%, these two markets seem most vulnerable to increased pressure on rents.
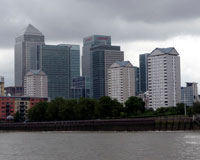
Signs of declining demand from the financial sector could be seen over the year in Docklands, which in 2016 saw just 29,000 sq ft let to financial occupiers, compared with 651,000 sq ft the previous year. However, despite reduced demand from the financial sector, Docklands may be the market most resilient to rental contraction. EGi’s consensus rents indicate that in 2016 Canary Wharf showed the strongest year-on-year rental growth, at 7%.
While banks have reduced the amount of space they occupy at Canary Wharf – with Credit Suisse subletting 315,535 sq ft at 5 Canada Square to Thomson Reuters, and Barclays Bank subletting 536,398 sq ft at 10 South Colonnade to the Government Property Unit – the occupiers snapping up this space up demonstrate the increasing diversity of business types interested in taking large floorplates in Docklands.
With the lowest proportion of space at risk of tenant vacation before 2022, lower average rents (at £46.08 per sq ft, compared with the City’s £69.25), and lower estimated changes in business rates expected, Docklands could lure occupiers from other sectors, such as TMT, and add resilience against rental contractions in this market.
Average rent and rent-free period Q4 2017
| Submarket | Location point | Average rent per sq ft | Annual change | Average months rent-free |
|---|---|---|---|---|
| City core | Gresham St/Leadenhall St/Broadgate | £69.25 | 3% | 22 |
| City fringe | Aldgate | £56.75 | 1% | 21 |
| Midtown | Chancery Lane | £68.07 | 2% | 20 |
| Midtown | Covent Garden | £82.07 | -1% | 17 |
| Midtown | Euston Road | £70.29 | 4% | 19 |
| West End | Mayfair/ St James | £118.75 | -4% | 16 |
| West End | Victoria | £79.17 | 0% | 19 |
| West End | Soho | £87.08 | 2% | 17 |
| West End | Paddington | £65.83 | 4% | 18 |
| South Bank | More London | £64.29 | 3% | 19 |
| Docklands | Canary Wharf | £46.08 | 7% | 25 |
Who took the most space in London’s markets in 2016?
| Share of space taken | Share of space vacated | |
|---|---|---|
| Financial | 17.32% | 32.72% |
| TMT | 28.25% | 16.86% |
| Professional | 8.37% | 10.21% |
| Property | 11.17% | 7.45% |
| Services | 4.85% | 4.85% |
| Retail & leisure | 7.87% | 4.81% |
| Others/Misc | 4.49% | 4.79% |
| Insurance | 2.32% | 4.45% |
| Central & local government | 7.01% | 3.99% |
| Associations | 2.02% | 3.85% |
| Industry & manufacturing | 2.91% | 3.09% |
| Construction | 3.43% | 2.93% |
| Docklands take-up 2016 | sq ft |
|---|---|
| Central & Local Government | 536,398 |
| TMT | 455,537 |
| Others | 152,248 |
| Construction | 63,132 |
| Property | 38,864 |
| Financial | 29,440 |
| Services | 18,464 |
| Professional | 10,221 |
| Retailing | 4,550 |
| Associations | 2,424 |
| Industry & Manufacturing | 2,384 |
| Total | 1,313,662 |
LONDON WEEK
• EGL Forum: Is expansion right for Heathrow? …read more
• Will second helpings sate the London restaurant market? …read more
• How bad is London’s rental contraction? …read more