


Offices have delivered more London homes in the last three years than in the preceding 10.
More than 1,500 homes are expected to complete through conversions this year, according to EG’s London Research, significantly higher than 2016’s total of 908 homes (which itself represented a 50% growth in completions on 2015).
The overwhelming majority of office-to-resi conversions are from ‘traditional’ applications for change of use, refurbishment, or part-demolition and rebuild. Exclusion zones for permitted development applications (PD Rights) cover almost all of EG’s central London geographical area and appear to be performing their job well, with only a fraction of the pipeline coming as a result of those developments.
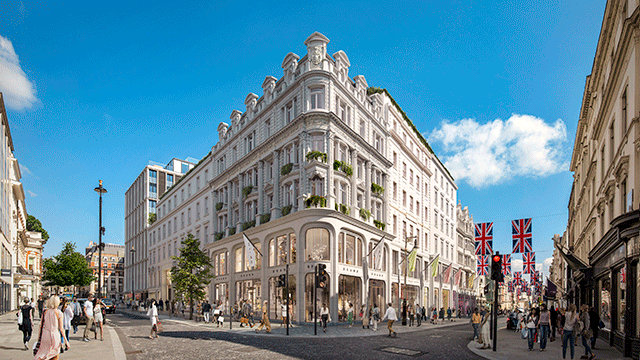
Three-quarters of the units delivered through conversions since 2014 have come in the West End and Midtown submarkets – in which some buildings were ‘flipped back’ to residential use having previously been converted from homes into offices.
There is scope for this trend to move further east as the City core market bears up to a trident of pressures that threaten to derail its superb office performance over the last few years:
- It appears that it will bear a greater proportionate burden of business rate increases than many of the other submarkets across the capital, based on the 2015 draft valuation lists.
- It has the second-highest reliance of all submarkets on financial businesses to maintain its high occupancy rate, with 39% of all floorspace let to the finance sector. Political negotiations will be critical to determining the scale of a hard Brexit impact on London, with passporting rights and Euro-denominated trading high on the agenda.
- It has the highest proportion of floorspace up for expiry before 2022, at 18%. This edges the City just above the West End, which has 17% of its floorspace up for expiry.
In stark contrast to the West End, which will see net stock levels drop if the entire current pipeline is built out, the City has a substantial development pipeline.
Nearly 44% of the new-build office space that EG is tracking in central London comes in the City core (chart); with minimal space earmarked for conversion from office space.
This makes the City core’s office market much more vulnerable to sharp rental decreases if the risk of oversupply is not mitigated through conversions.
Whether those conversions are to residential units is another matter. Gymnasiums, hotels and restaurants have all, to varying degrees, been the focus of office conversions over the past 10 years – but of course none of those have quite the same national and regional focus that is currently lasered onto the development of new homes.
Another consideration is whether the recent downward movement of prime residential prices in central London will cause a rethink from investors and developers who may have previously eyed the City as a viable location for a large-scale residential project based on the aforementioned pressures on offices.
It might be a little strange or revolutionary for the City core to be a genuinely viable location for the expansion of the office-to-residential trend – but for London’s office market, the challenge over the next couple of years will be on trying to maintain relative buoyancy while adapting to unprecedented change.
For that to happen, it may necessitate some revolutionary thoughts being put into practice.
LONDON OFFICE TO RESI IN FIGURES
COMPLETION v CONVERSION
| Homes completed via “traditional” conversion of office space | Homes completed through PD Rights applications | Units under construction “traditional” conversion of office space | Units under construction through PD Rights applications | |
| 2004 | 22 | |||
| 2005 | 87 | |||
| 2006 | 212 | |||
| 2007 | 210 | |||
| 2008 | 532 | |||
| 2009 | 163 | |||
| 2010 | 308 | |||
| 2011 | 51 | |||
| 2012 | 160 | |||
| 2013 | 75 | |||
| 2014 | 466 | 14 | ||
| 2015 | 606 | |||
| 2016 | 892 | 16 | ||
| 2017 [forecast] | 1,522 | 41 | ||
| 2018 [forecast] | 1,202 | |||
| 2019 [forecast] | 423 |
TOTAL CENTRAL LONDON DEVELOPMENT PIPELINE BY SUBMARKET
(inc CONVERSIONS)
| Total under construction (new-build offices) | Total at permission (new-build offices) | Total under construction (conversions from offices) | Total at permission (conversions from offices) | |
|---|---|---|---|---|
| City core | 7,272,651 | 6,408,654 | – 298,418 | – 344,423 |
| City fringe | 1,694,123 | 1,722,580 | – 20,021 | – 221,736 |
| Docklands | 755,378 | 2,095,010 | – 420,201 | – 31,313 |
| Midtown | 1,810,215 | 2,152,479 | – 690,676 | – 503,353 |
| Southern fringe | 840,833 | 1,897,568 | – 249,055 | – 66,123 |
| West End | 2,052,500 | 2,719,693 | – 747,177 | – 4,119,744 |
| TOTAL | 14,425,701 | 16,995,984 | – 2,425,549 | – 5,286,693 |
• To send feedback, e-mail graham.shone@estatesgazette.com or tweet @GShoneEGi or @estatesgazette
LONDON WEEK
• EGL Forum: Is expansion right for Heathrow? …read more
• Will second helpings sate the London restaurant market? …read more
• How bad is London’s rental contraction? …read more